Introduction #
Honeypots are deceptive tools used in cybersecurity to attract and trap malicious actors. By simulating vulnerabilities, they divert attackers from real assets while gathering valuable intelligence on their tactics and methods.
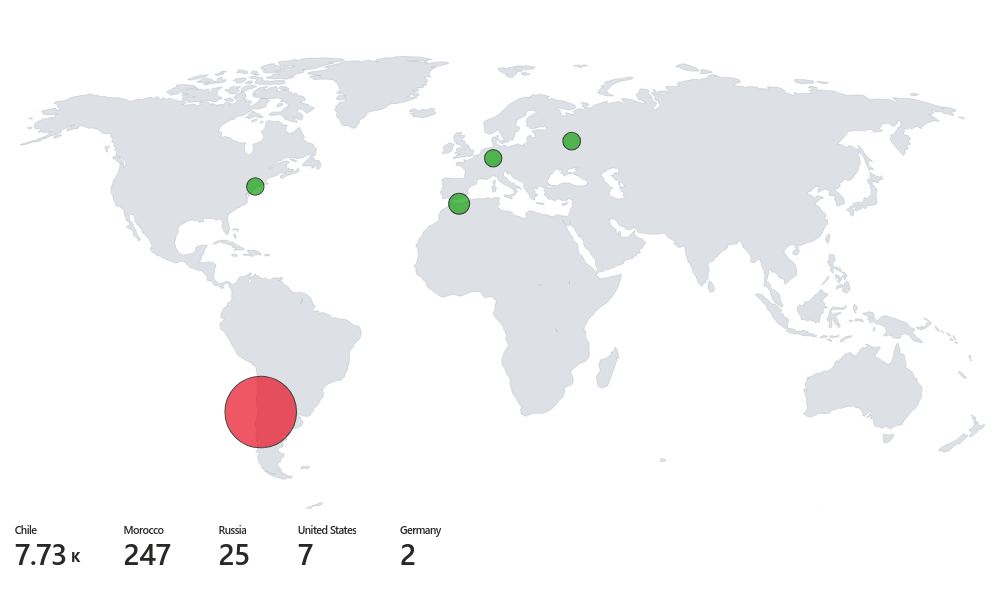
This strategy helps organizations enhance their security posture, understand emerging threats, and develop effective defensive measures against cybercrime. In this particular project we can see the bad actors trying to access our Windows VM through RDP.
Setting Up the VM #
I chose to use Azure for this project due to my familiarity with the platform and the added benefit of a $200 credit. While this project can also be executed on AWS, the steps would differ significantly. In AWS Amazon GuardDuty can be used for the SIEM.
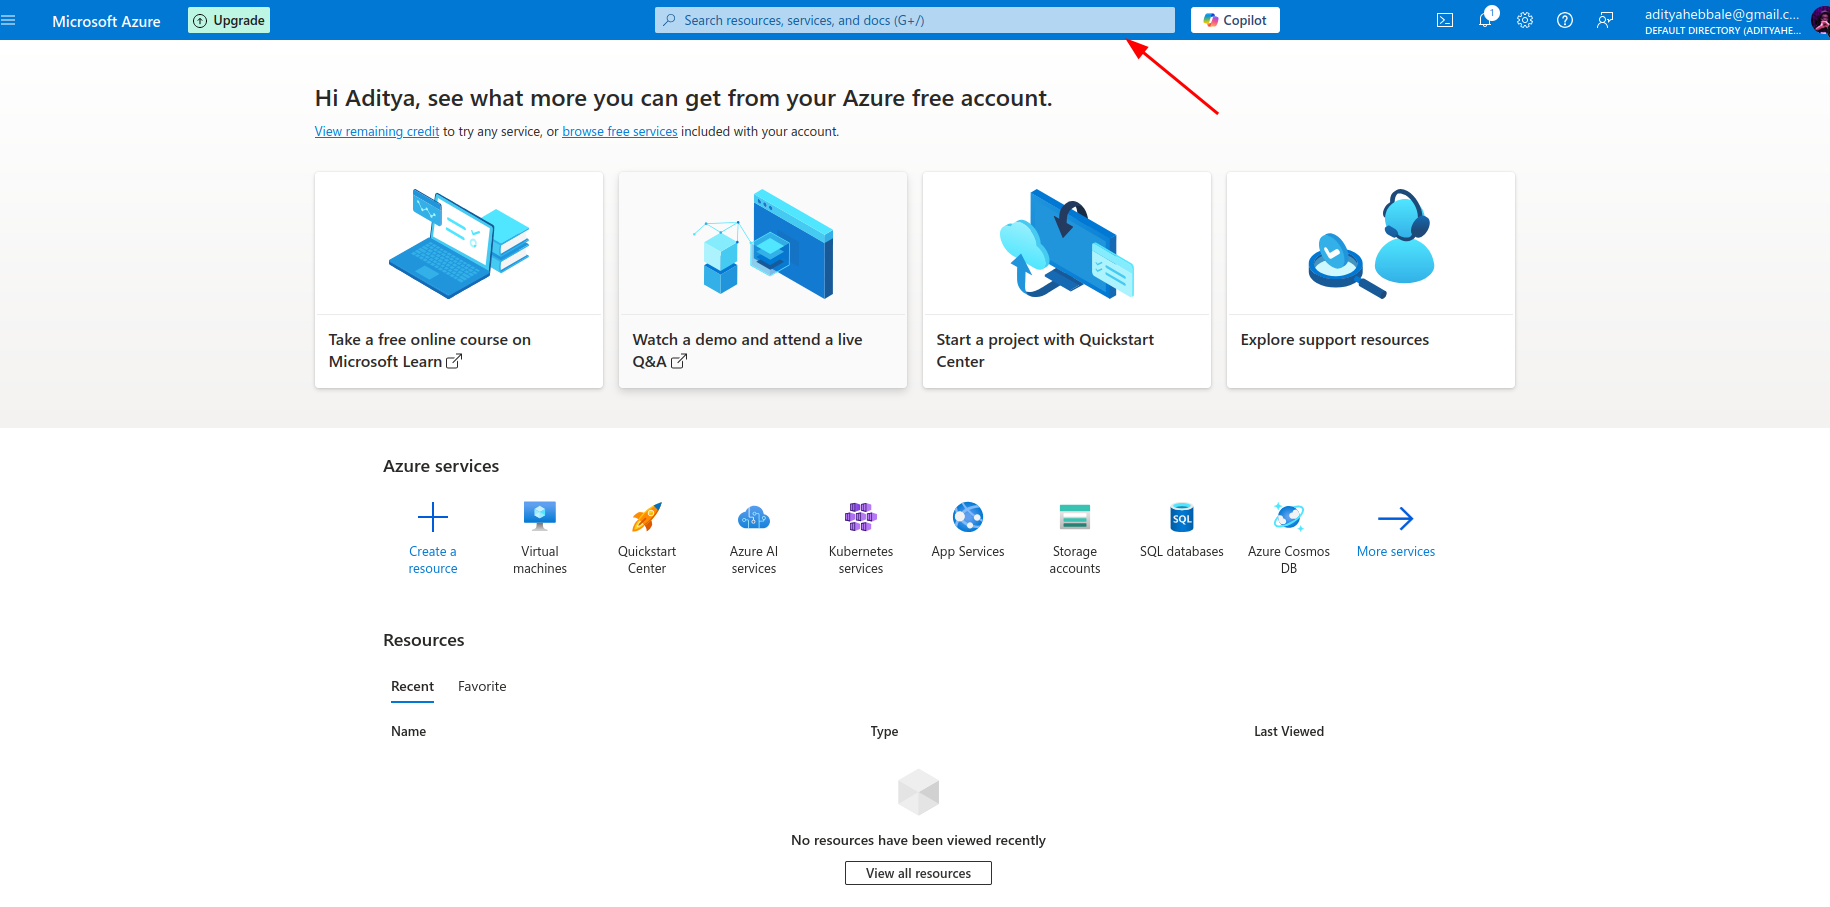
Create an Azure account and head to https://portal.azure.com/. You will get 200$ credits for free and it will be more than enough to complete this project for free.
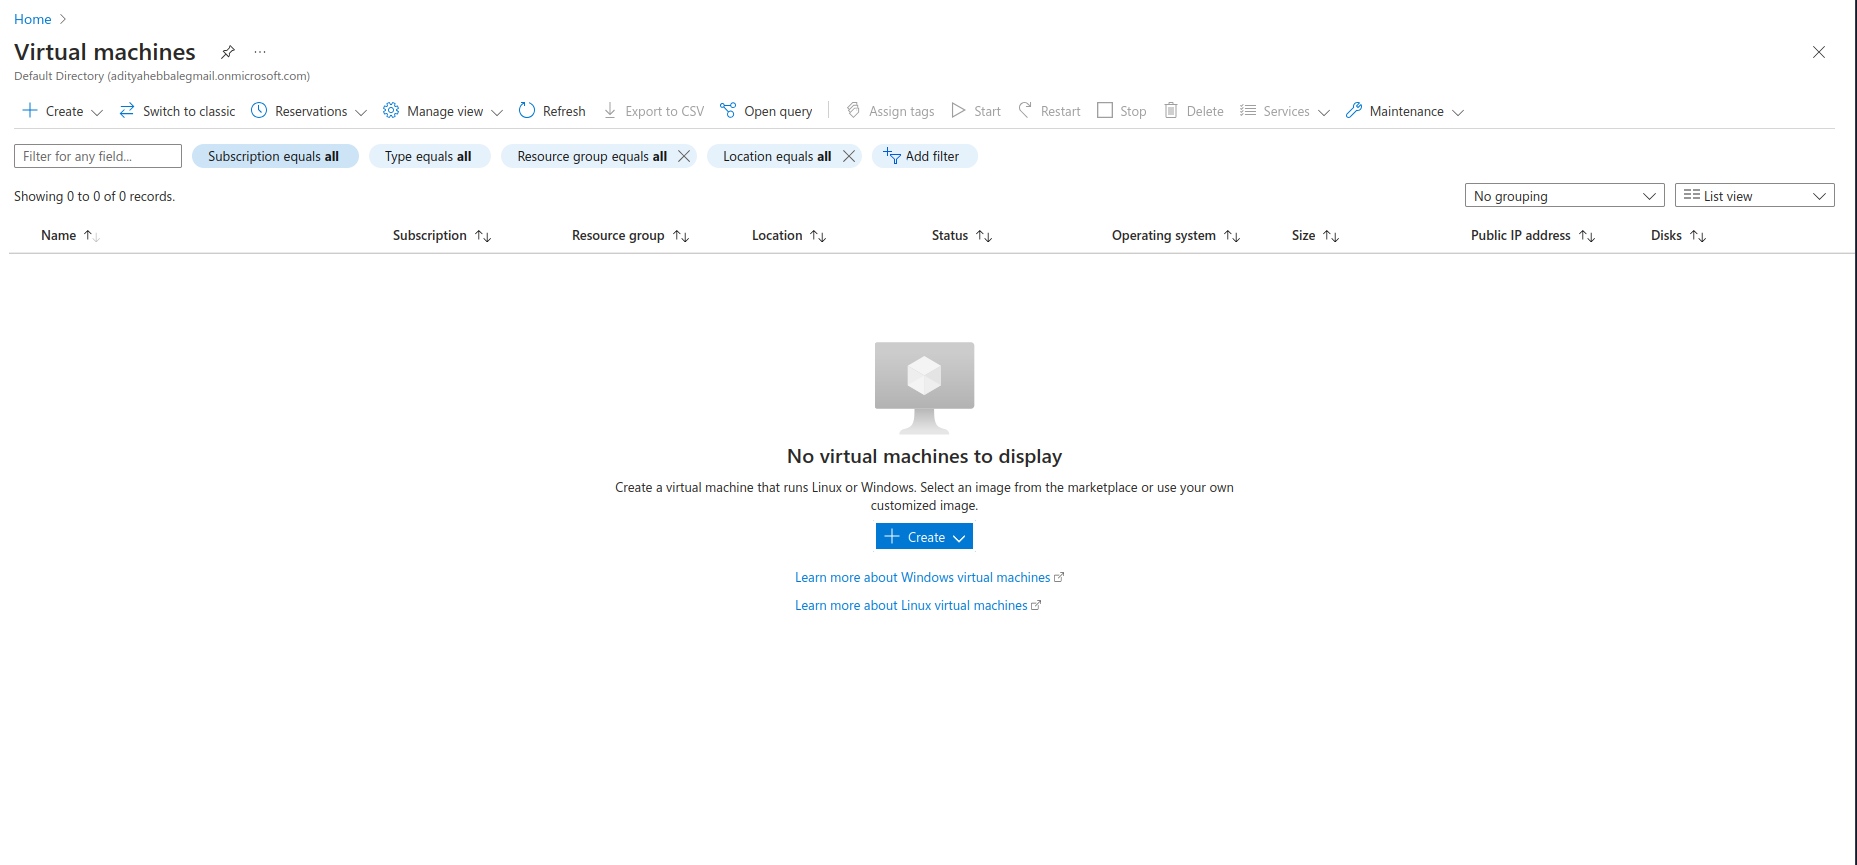
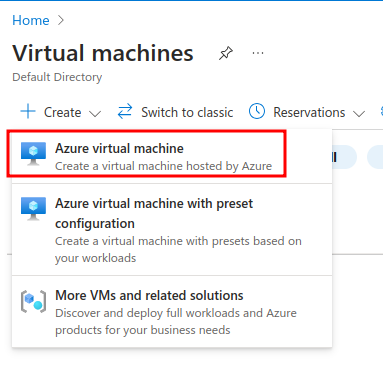
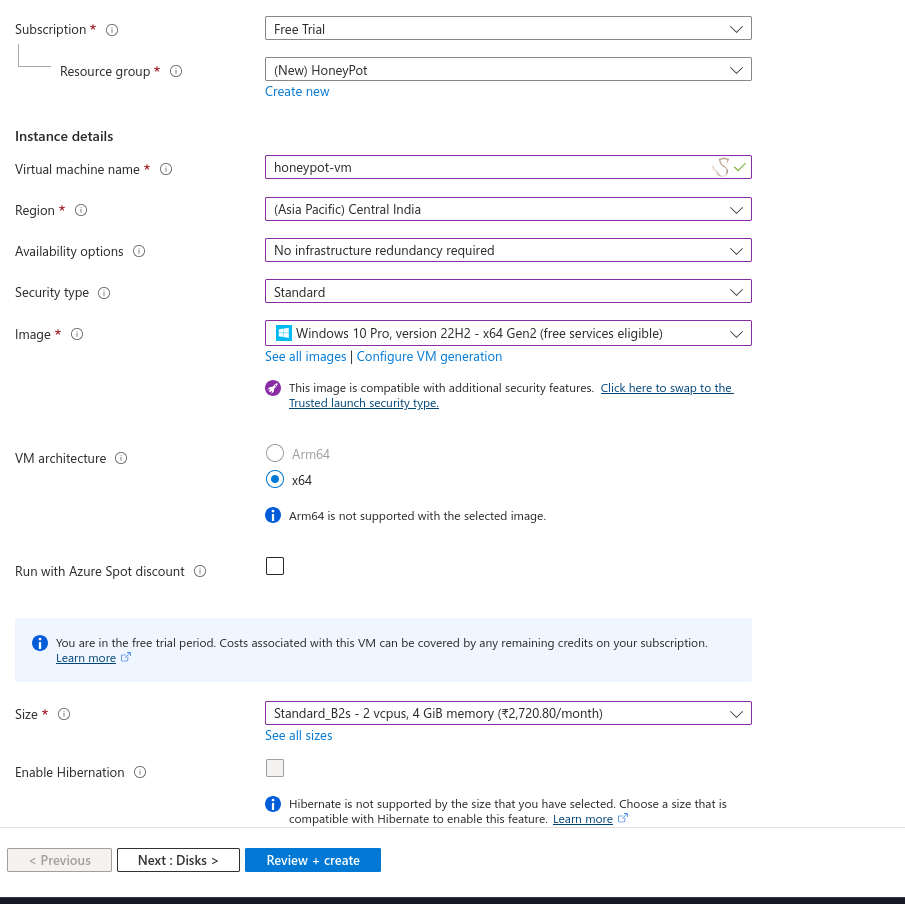
Now I will select the following settings:
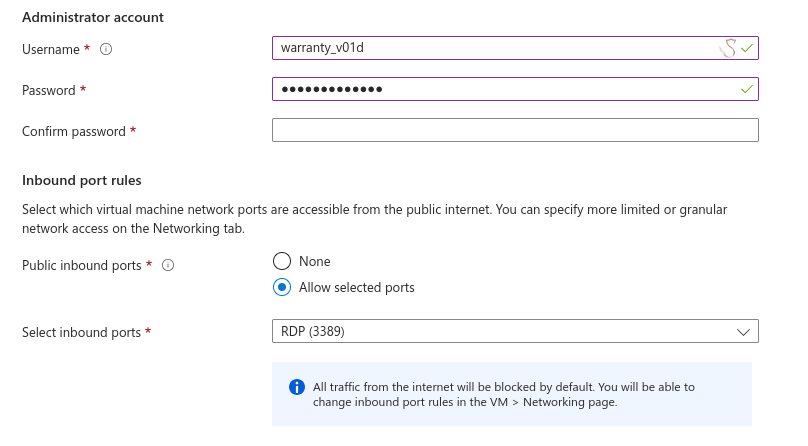
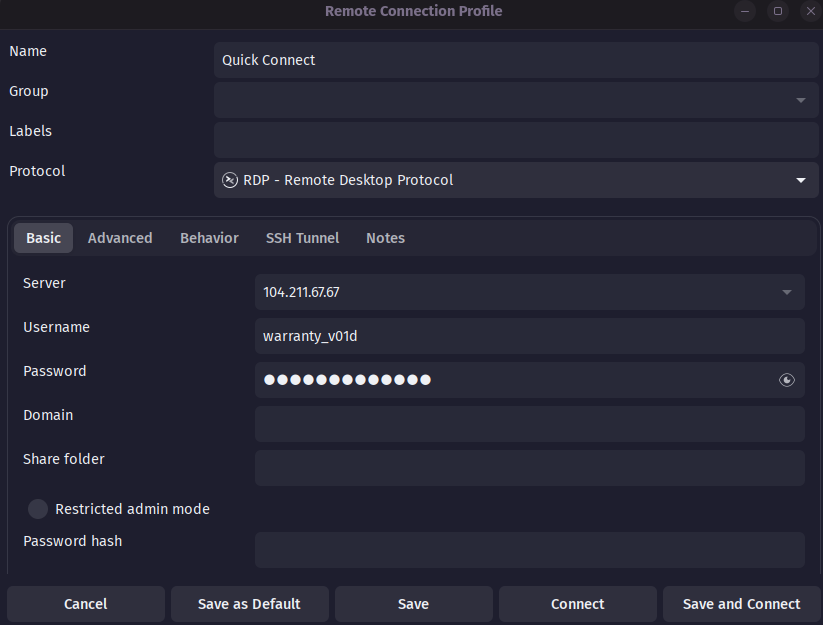
When creating the Administrator account take note of the Username & Password you input as we will use it later for logging in with RDP.
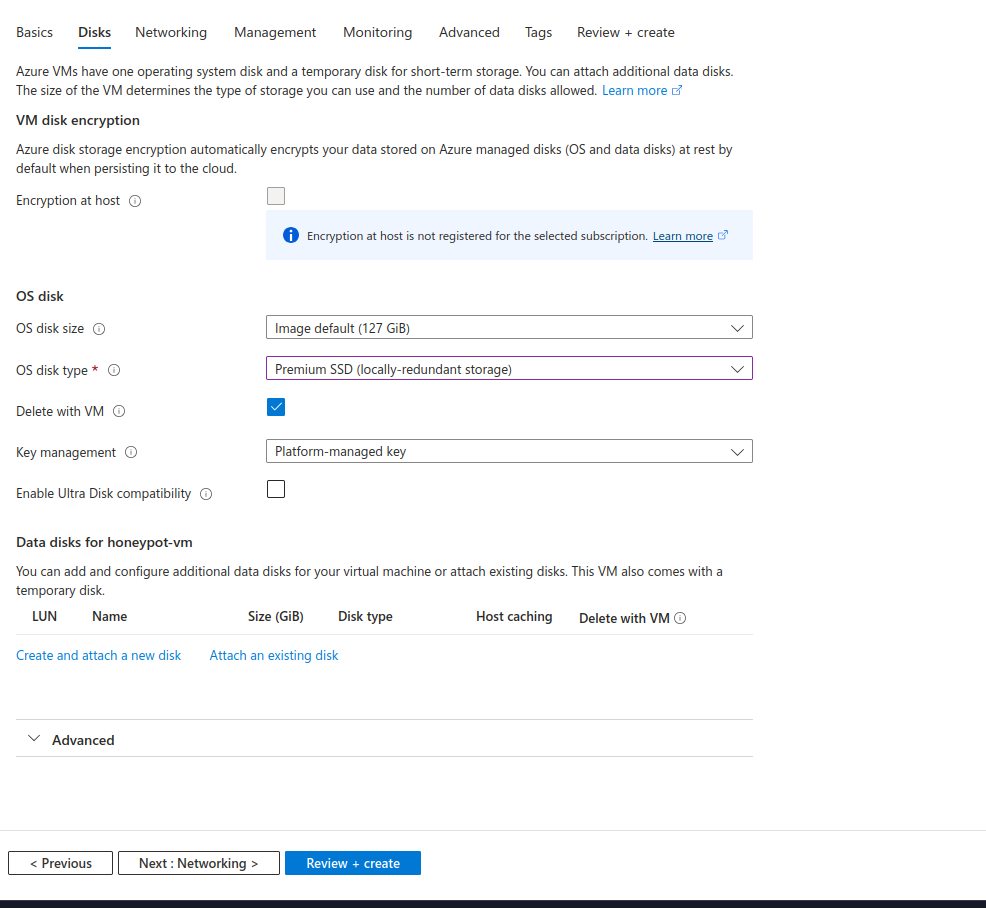
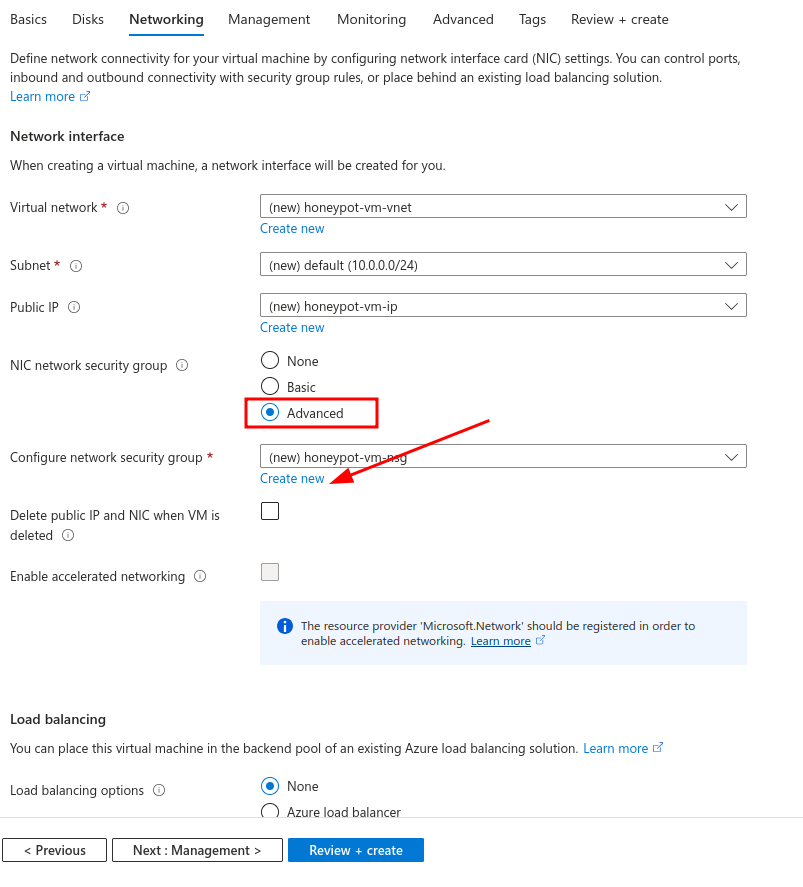
Set the NIC network security group to advanced and click on Create new.
Delete the default inbound rule and add the following:
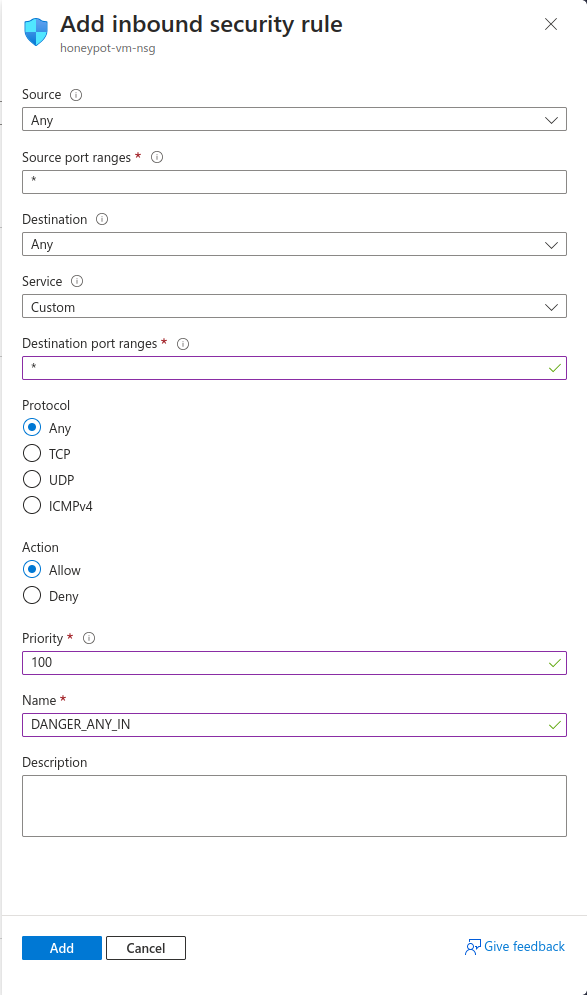
Click on the review+ create button and then create the VM. It might take a while to deploy, you can proceed with the next steps meanwhile.

Log Analytics workspaces #
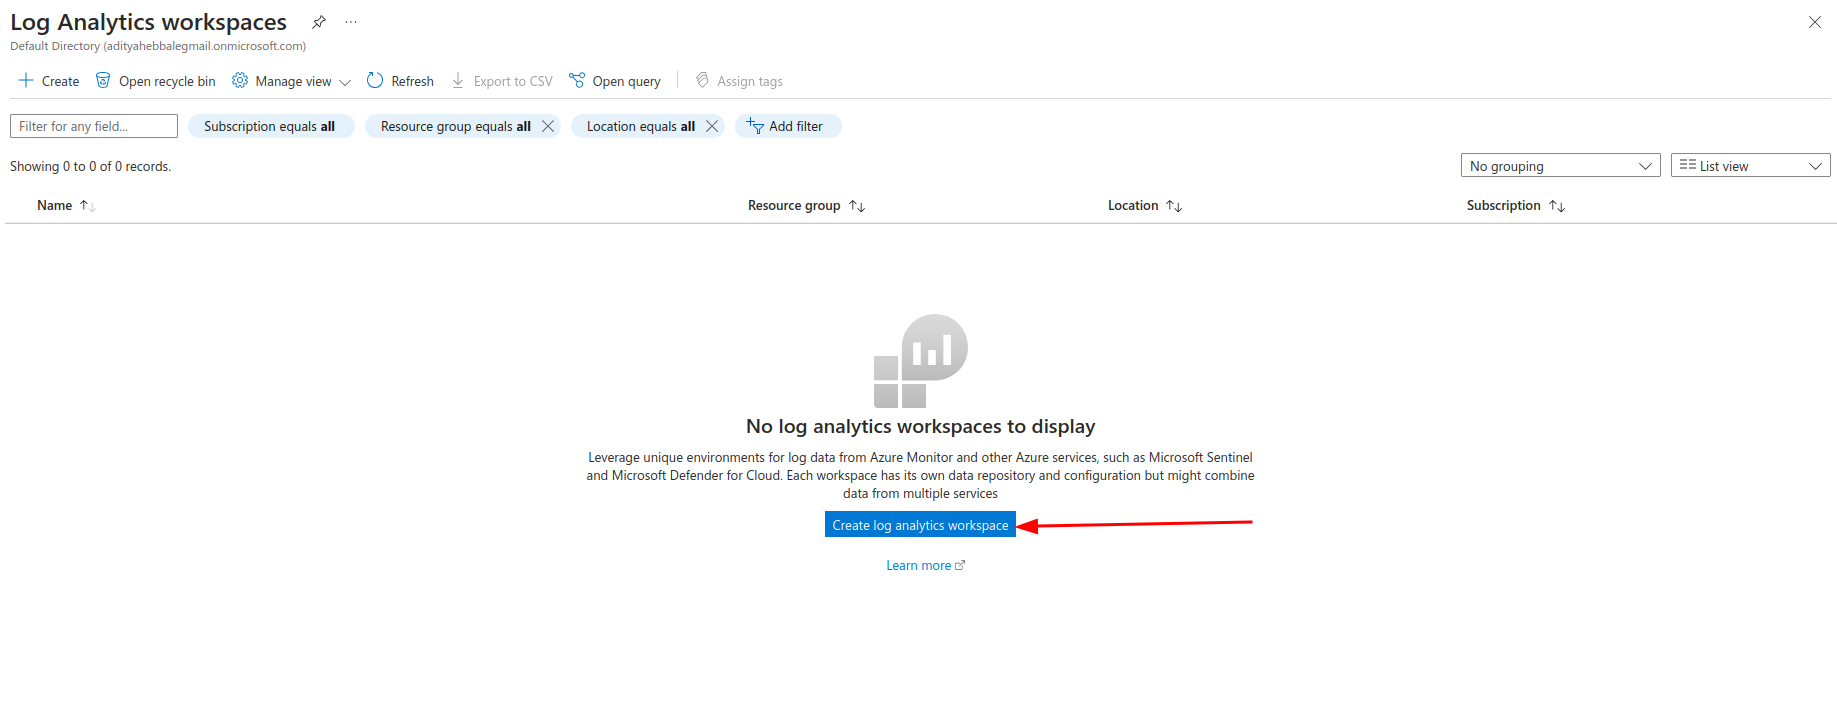
Next, search for Log Analytics workspaces in the Azure search: This is so that you can effectively track and analyze where attackers come from. Log Analytics Workspaces in Azure provides a centralized platform for collecting and analyzing log data from various sources, which is essential for security monitoring and threat detection. In this case from our VM’s logs.
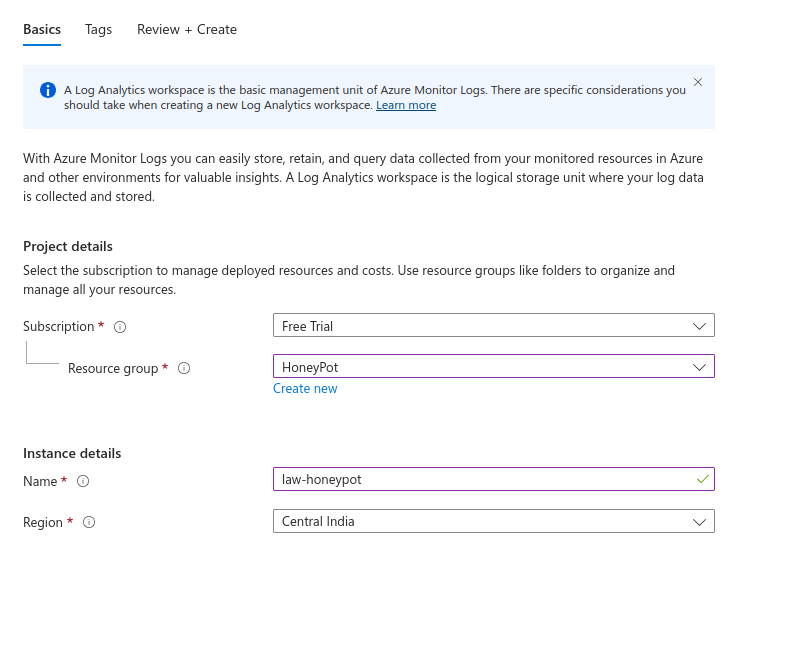
Select the previously created Resource group and a Region of your choosing. For the name I will be going with “law-honeypot” where law is Log Analytics workspaces.
Defender For Cloud #
Search for “Defender for Cloud” in Azure and go to it.
Go to environment settings and click on the 3 dots and edit settings as shown:
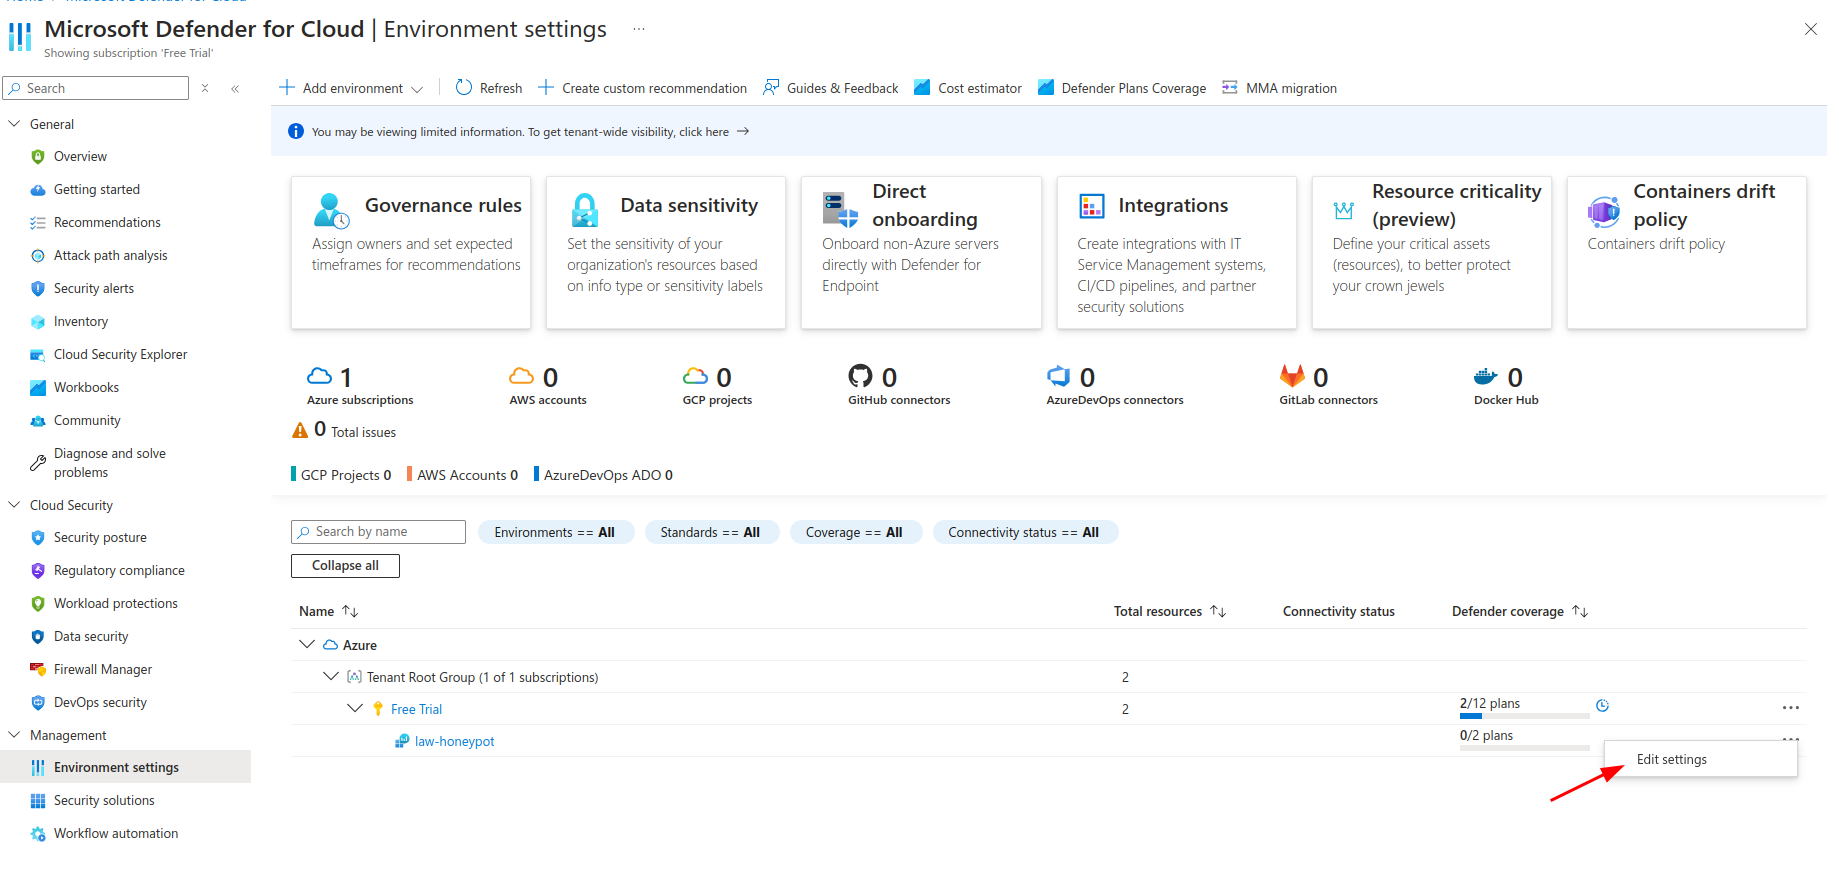
Enable Foundational CSPM and Servers option

Now head to Fata collection in the same page and enable All Events:
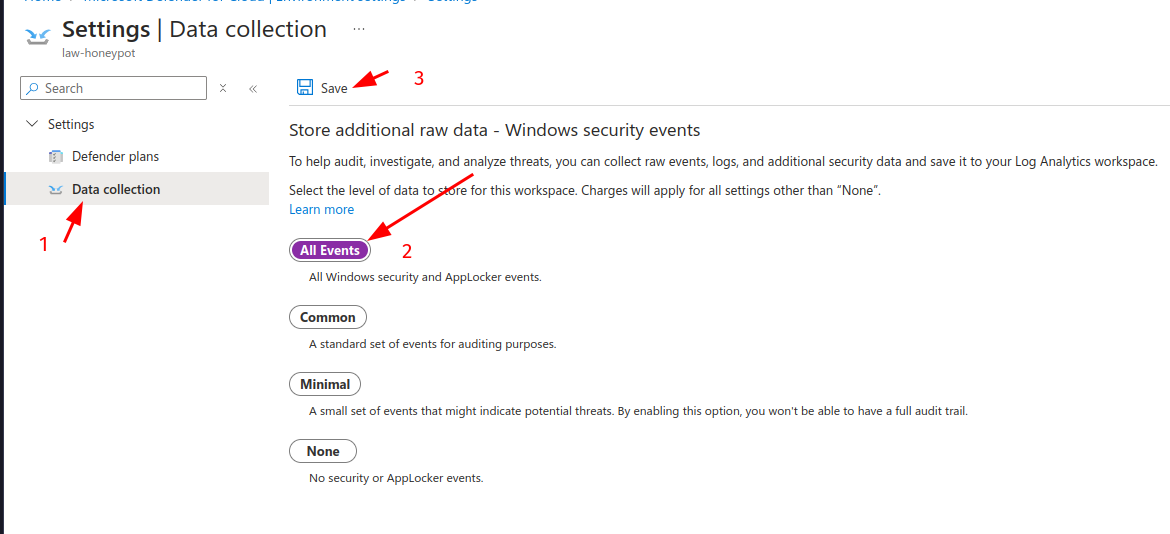
Connect VM to Log Analytics Workspaces #
Now head back to Log Analytics Workspaces
Virtual Machines in Log Analytics Workspaces was deprecated because Microsoft introduced Azure Monitor for VMs as a more comprehensive and scalable solution. For this project we will use the Virtual Machines in Log Analytics Workspaces as it is sufficient here.
Go to Virtual Machines in Log Analytics Workspaces:

Virtual Machines in Log Analytics Workspaces was deprecated in favor of Azure Monitor for VMs, which offers a more comprehensive and scalable solution. However, for this project, we will continue using Virtual Machines in Log Analytics Workspaces as it meets our current needs and is sufficient for the scope of this project.
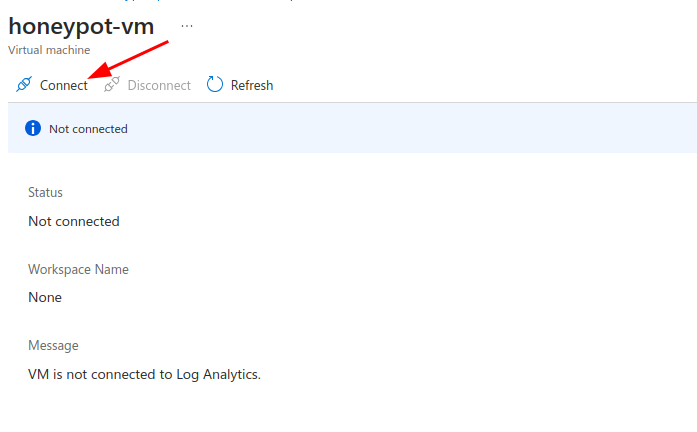
Azure Sentinel #
Search for Microsoft Sentinel and go to the page for it.

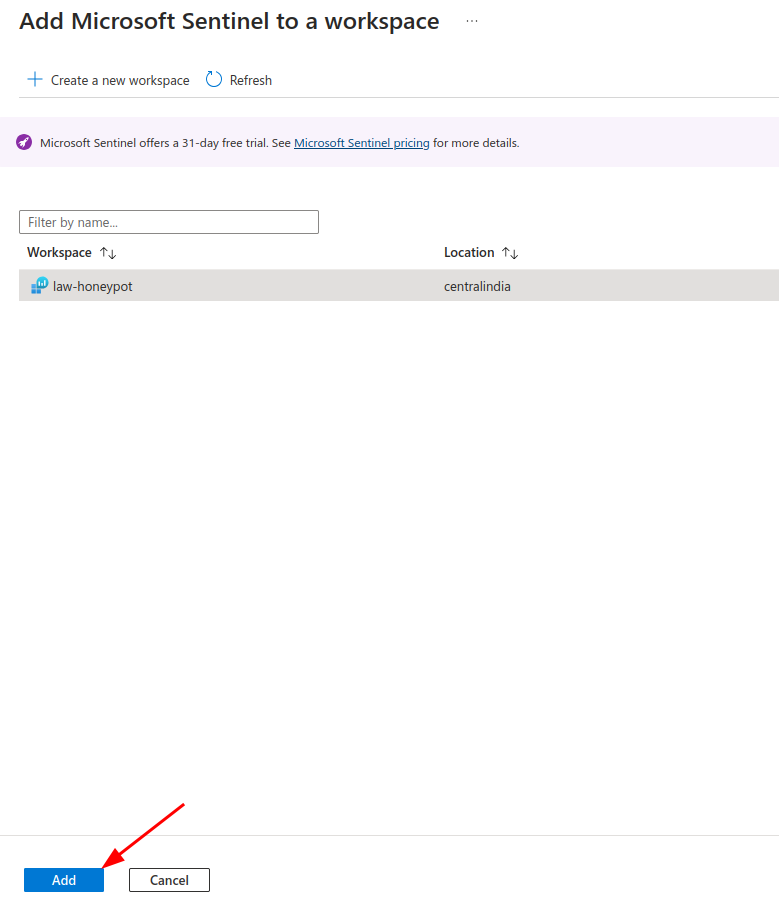
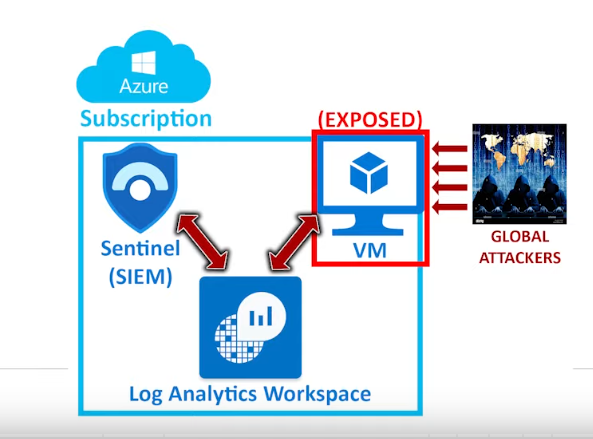
Now our setup should look something like this:
Disabling Firewall in VM #
Head to the Virtual Machine page in Azure, the VM would have deployed by this time. Take note of the public IP of our VM.
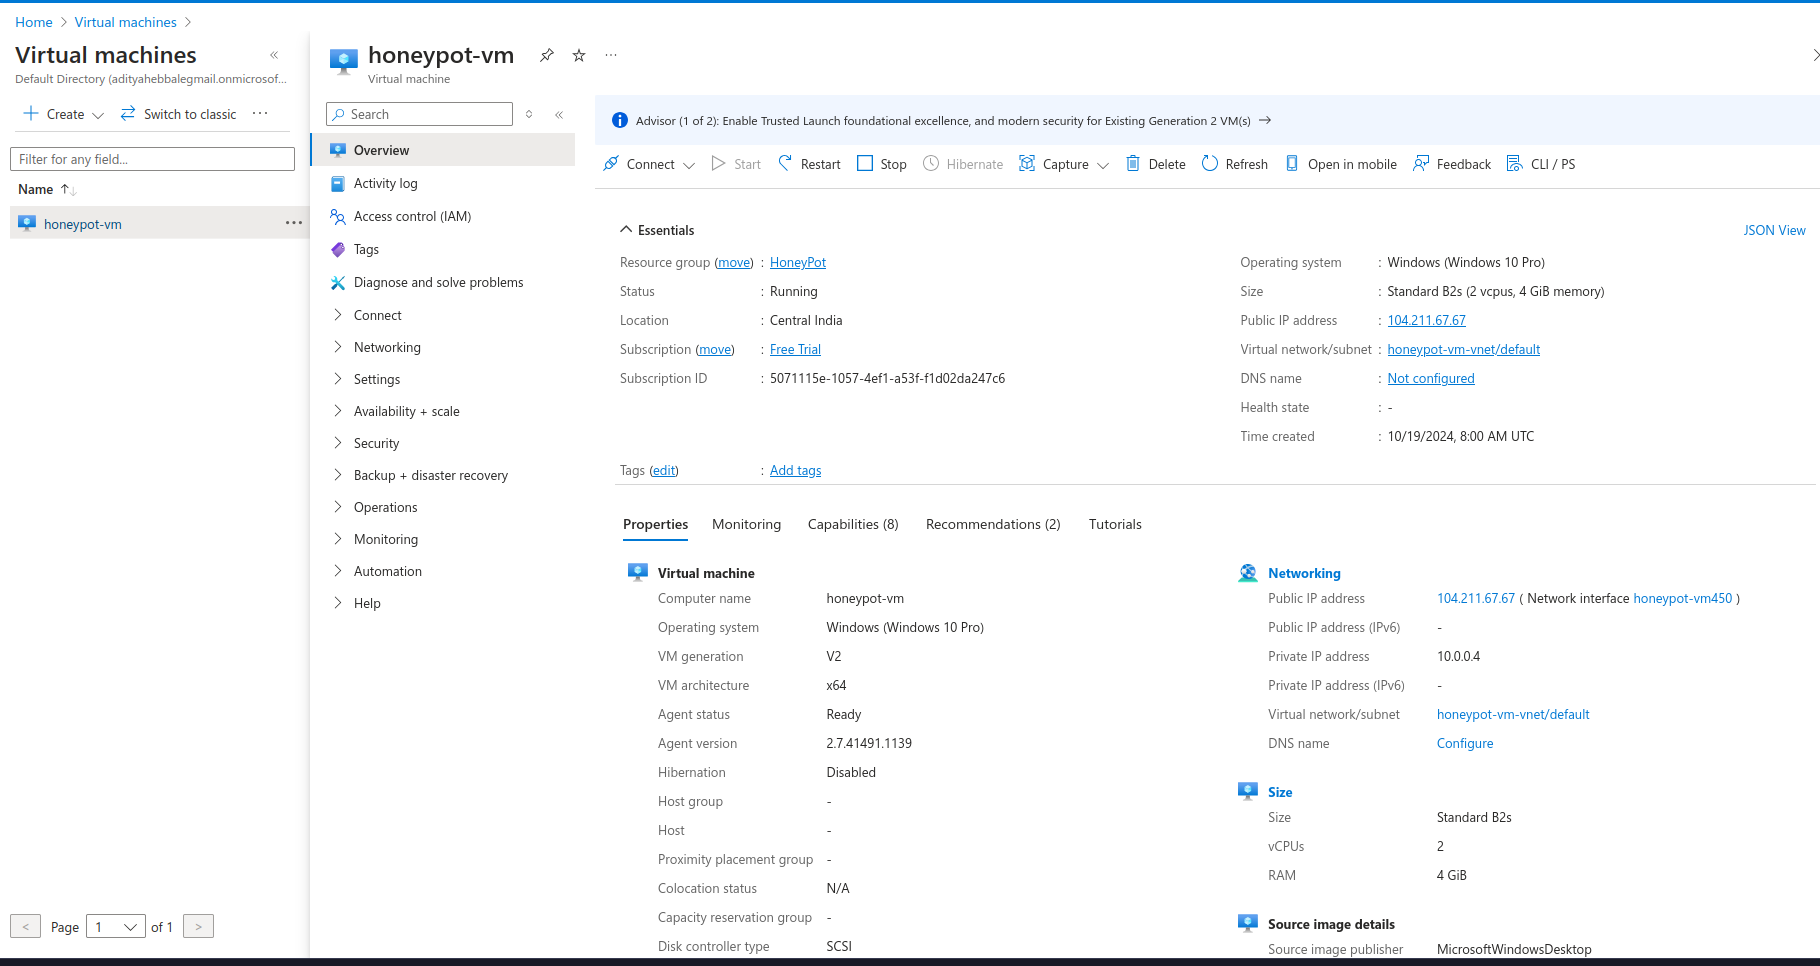
Now we need to connect to it using RDP, as I am using Linux I will use Remmina to RDP into the machine. If you are on Windows you can search for Remote Desktop Connection in the start menu.
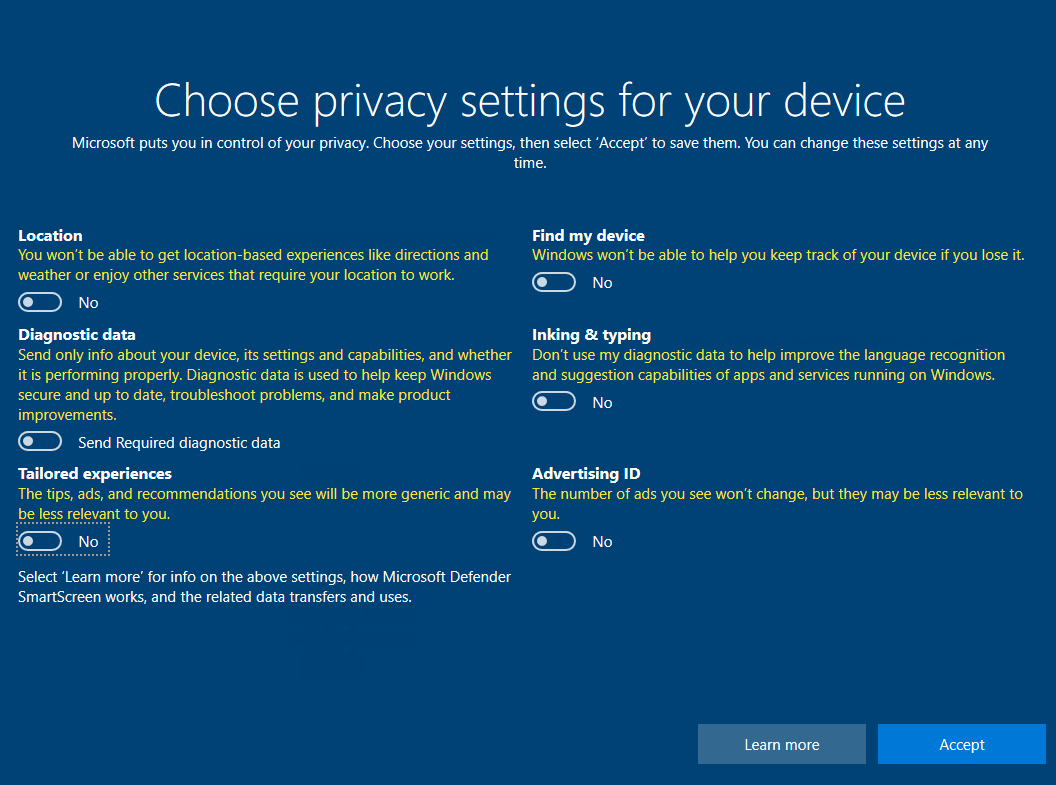
Open the Start Menu and open Event Viewer on the VM, Event Viewer is a built-in tool in Windows that allows you to view detailed logs of system, application, and security events.
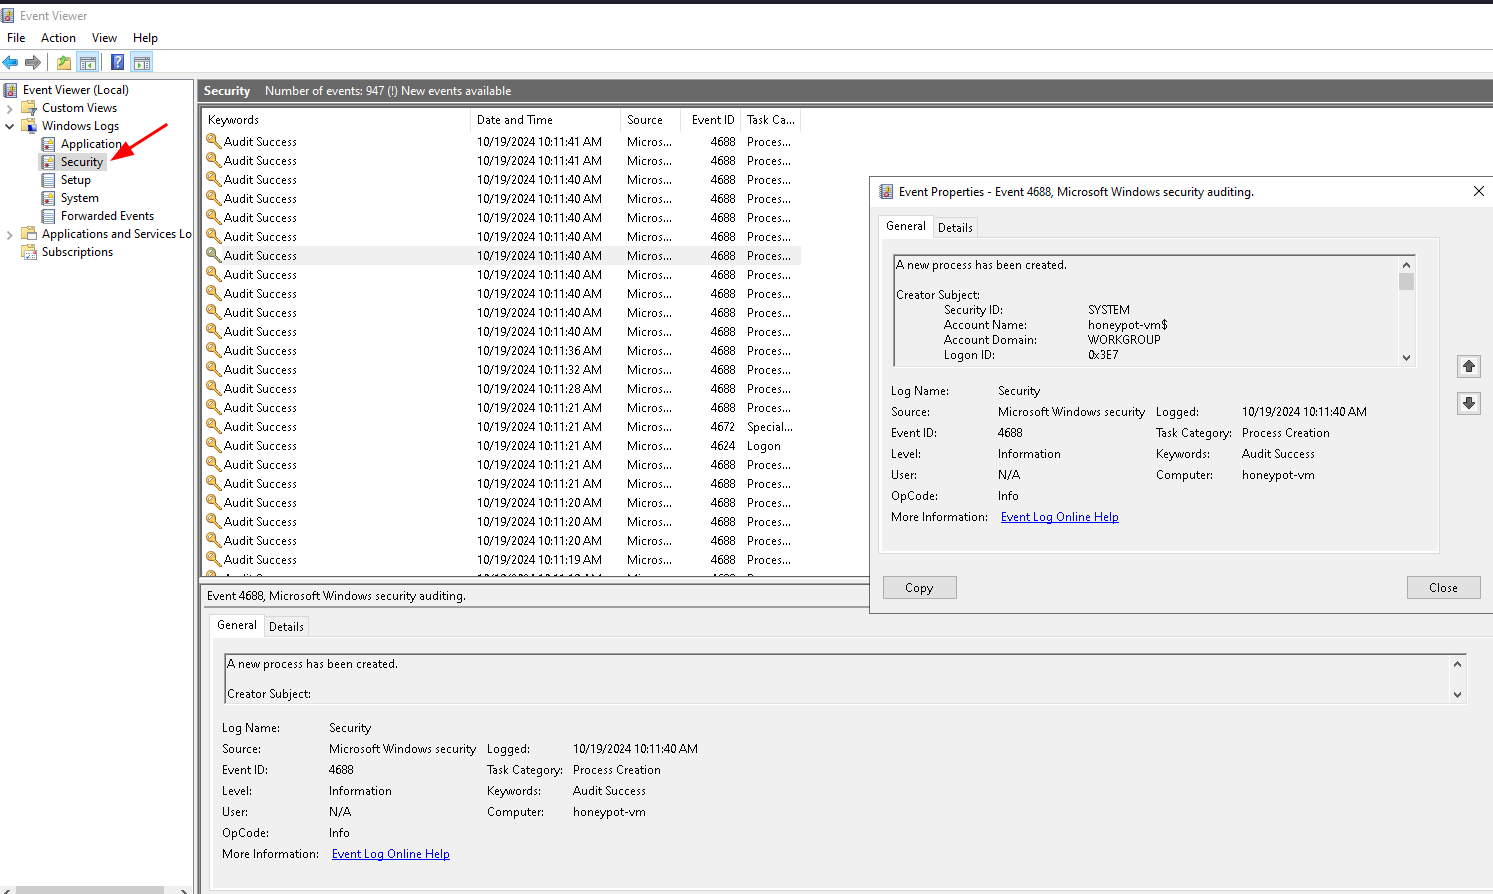
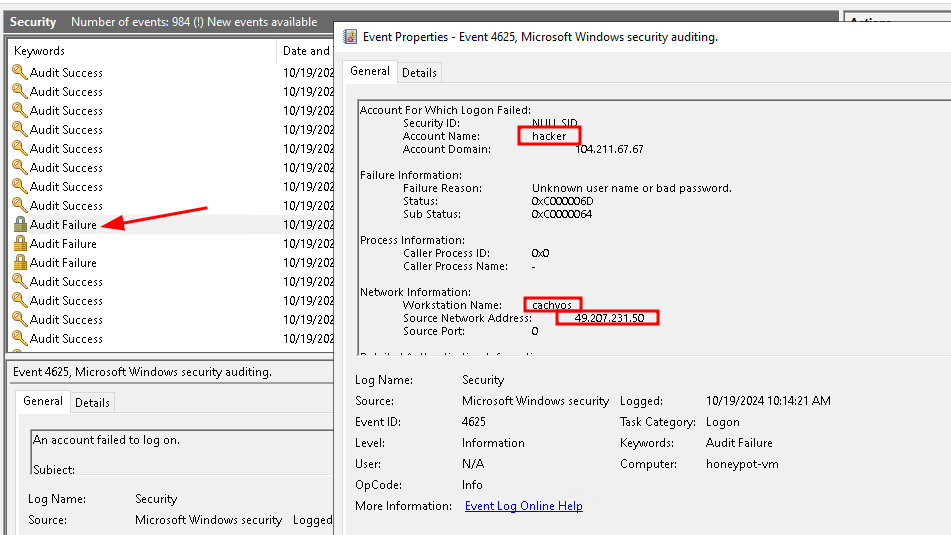
Later we will check the location of each IP using a script, this script will use ipgeolocation
We will now try to ping the VM from our machine. Use the Public IP you noted.
ping 104.211.67.67
We can see that it does not work due to firewall:

We will now disable the Firewall. Search for “wf.msc”:
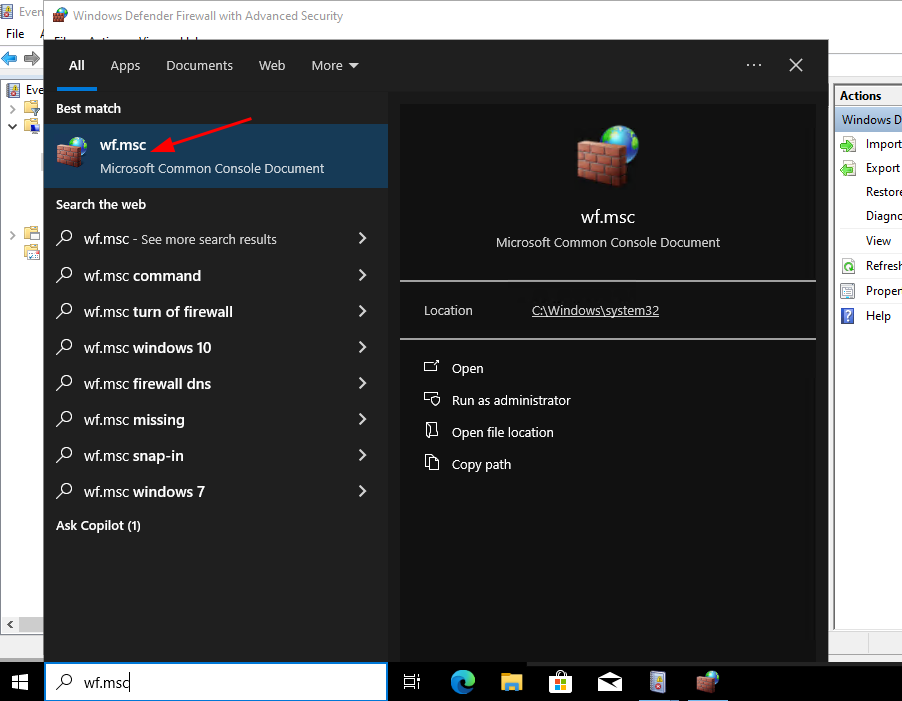
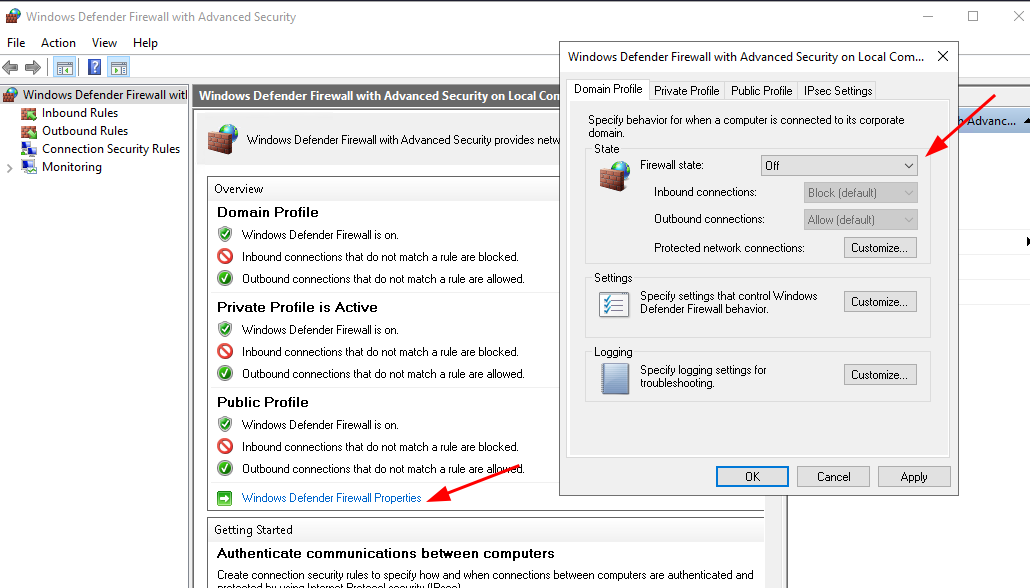
Disable the firewall, set it off for Domain, Private and Public profile as well:
Now we can see that the ICMP inbound connections are accepted:

We could have also made the firewall accept only certain connection type like ICMP,etc but as this is a Honeypot we can just disable the firewall completely
Logging the Logins #
Copy the contents of this powershell script: https://github.com/AdityaHebballe/Pentest-Scripts/blob/main/Log_exporter.ps1
Open Powershell ISE on the Windows VM and paste the contents.
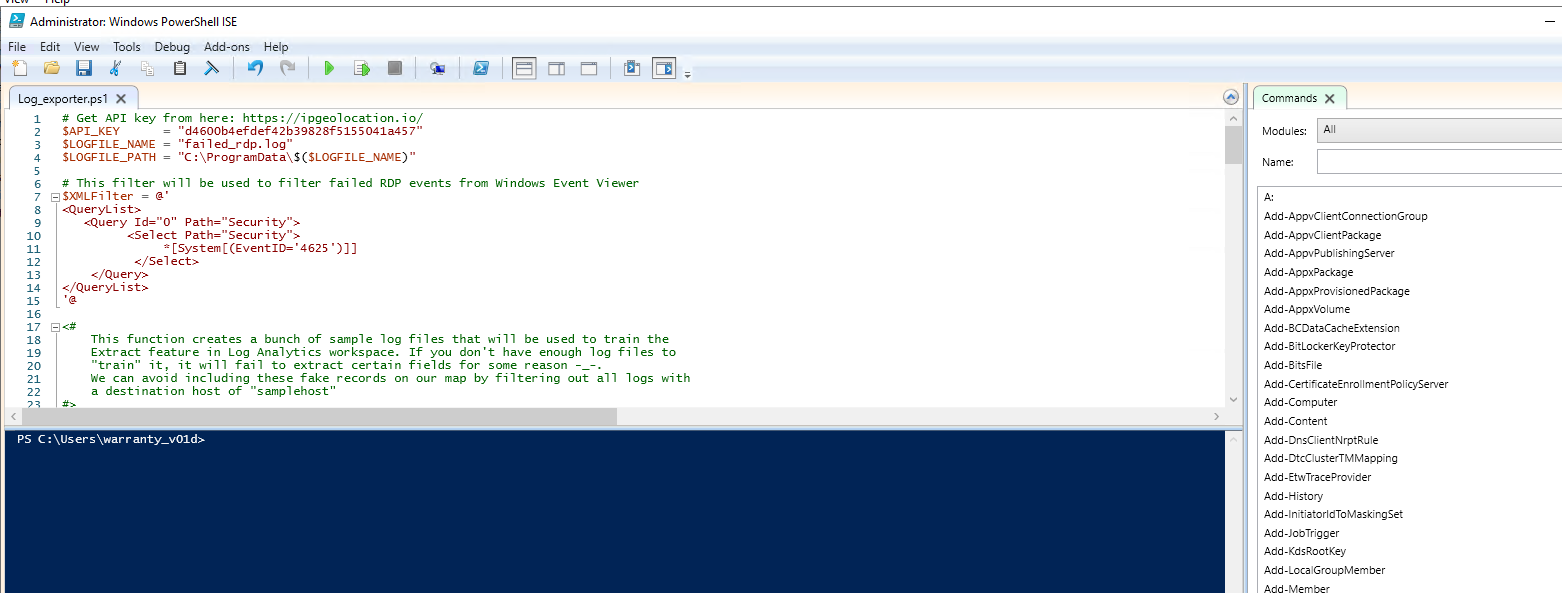

The logs are stored at C:\ProgramData\failed_rdp.log
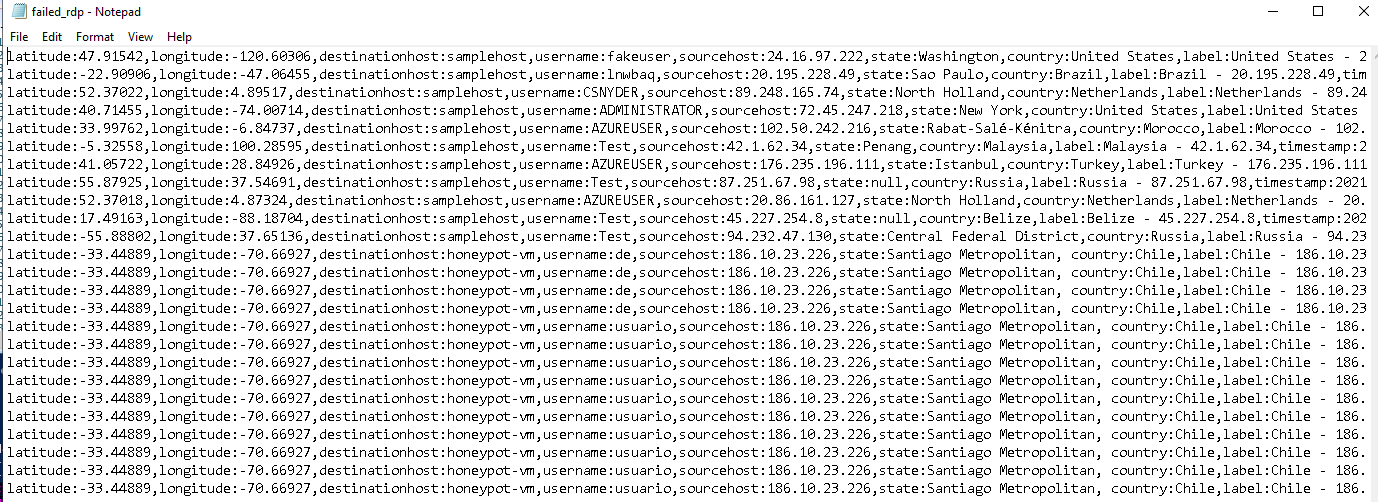
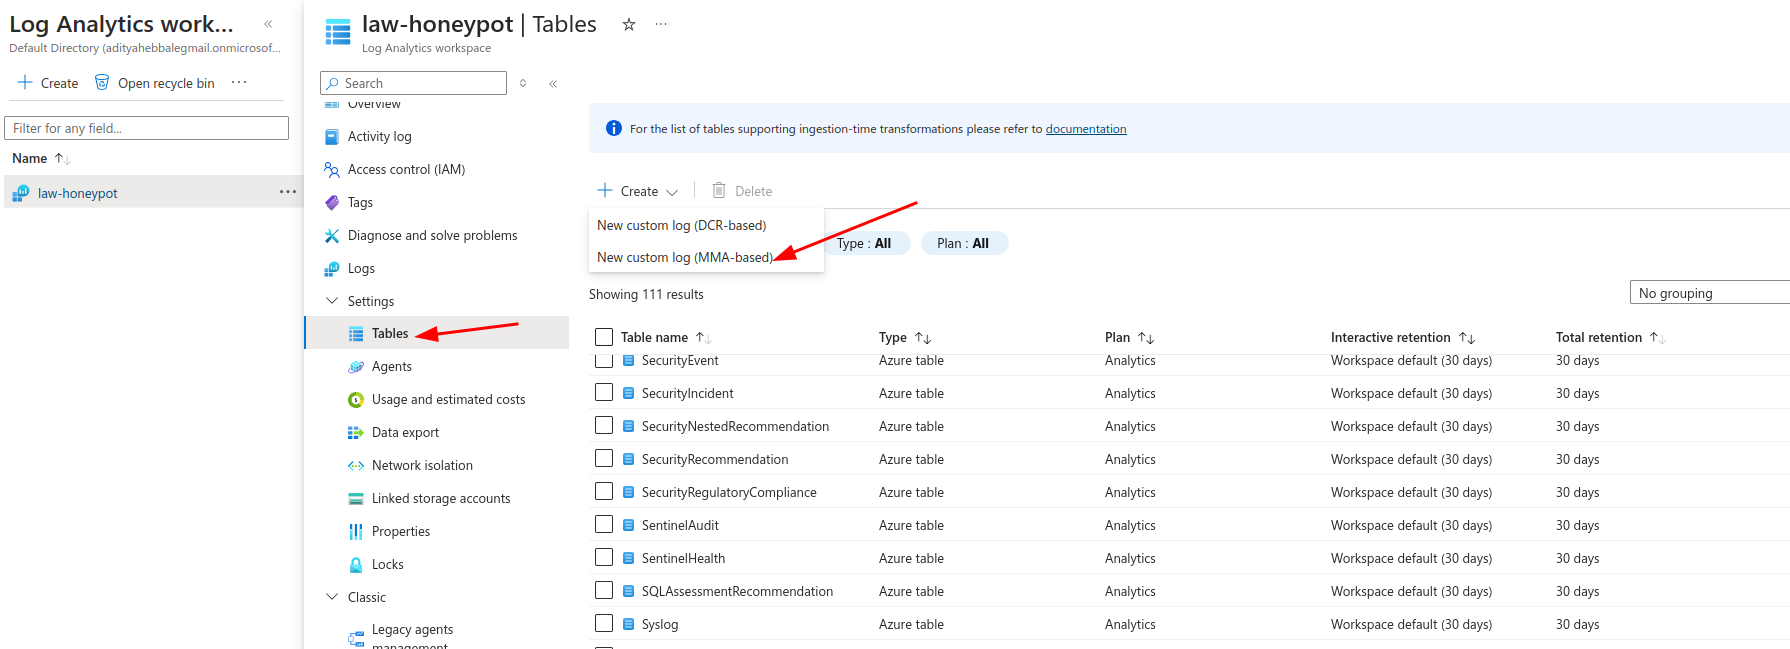
Now we will create Custom Logs:
Open Tables And create new Custom Log (MMA-Based):
Now make a .log file with the contents from failed_rdp.log on your local machine and upload:

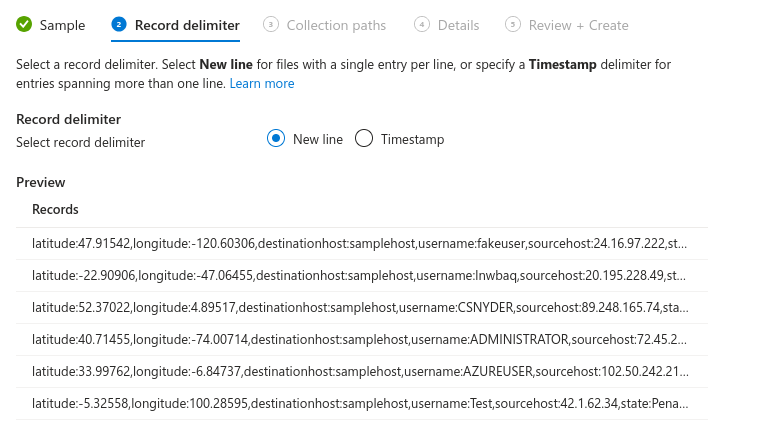
Set the path for the failed_rdp.log located at C:\ProgramData. Check if the file is created first, the location and filename is defined in the powershell script from eariler.

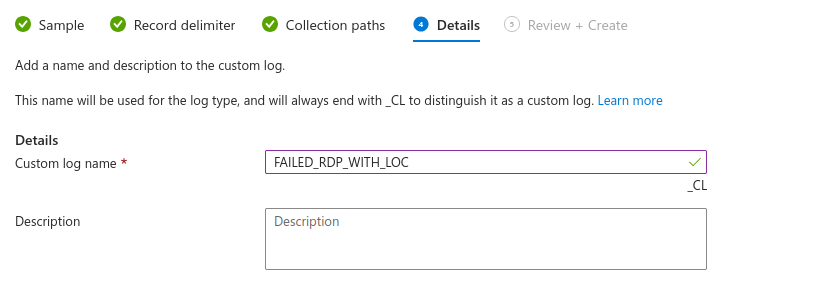
Review and create it:
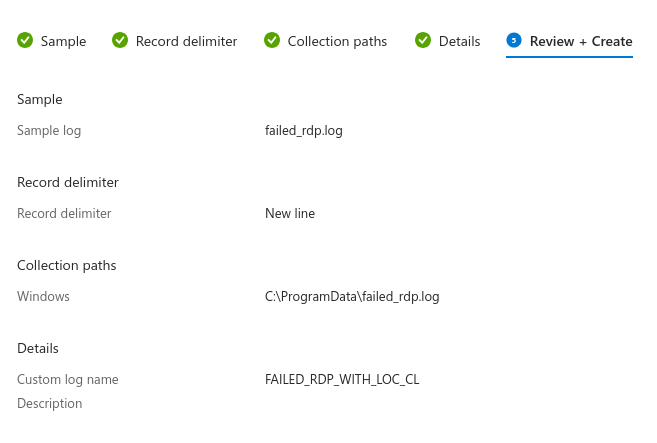
Now in logs section in Azure.
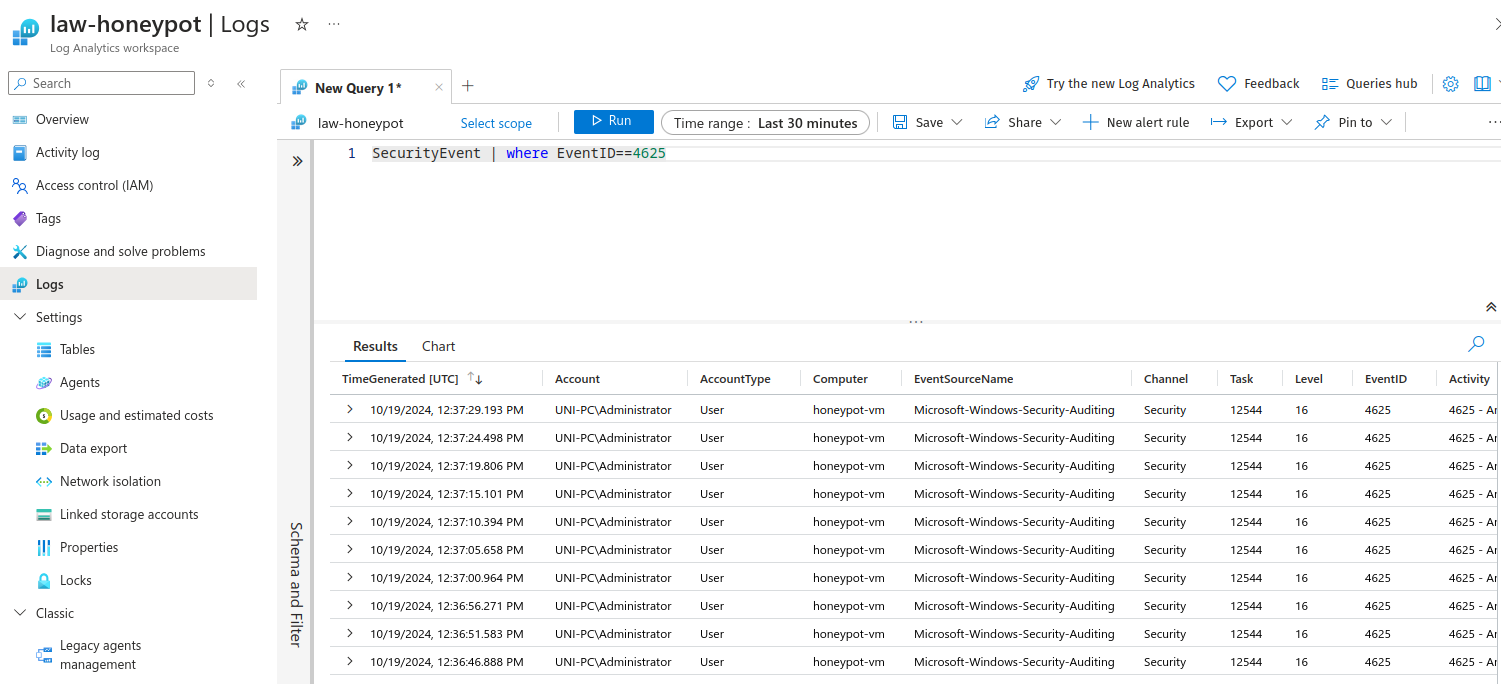
To manually find the failed rdp logins use Event ID=4625 as it indicates a failed login attempt:
Now we can try with our custom log, run the query with name of the custom log:
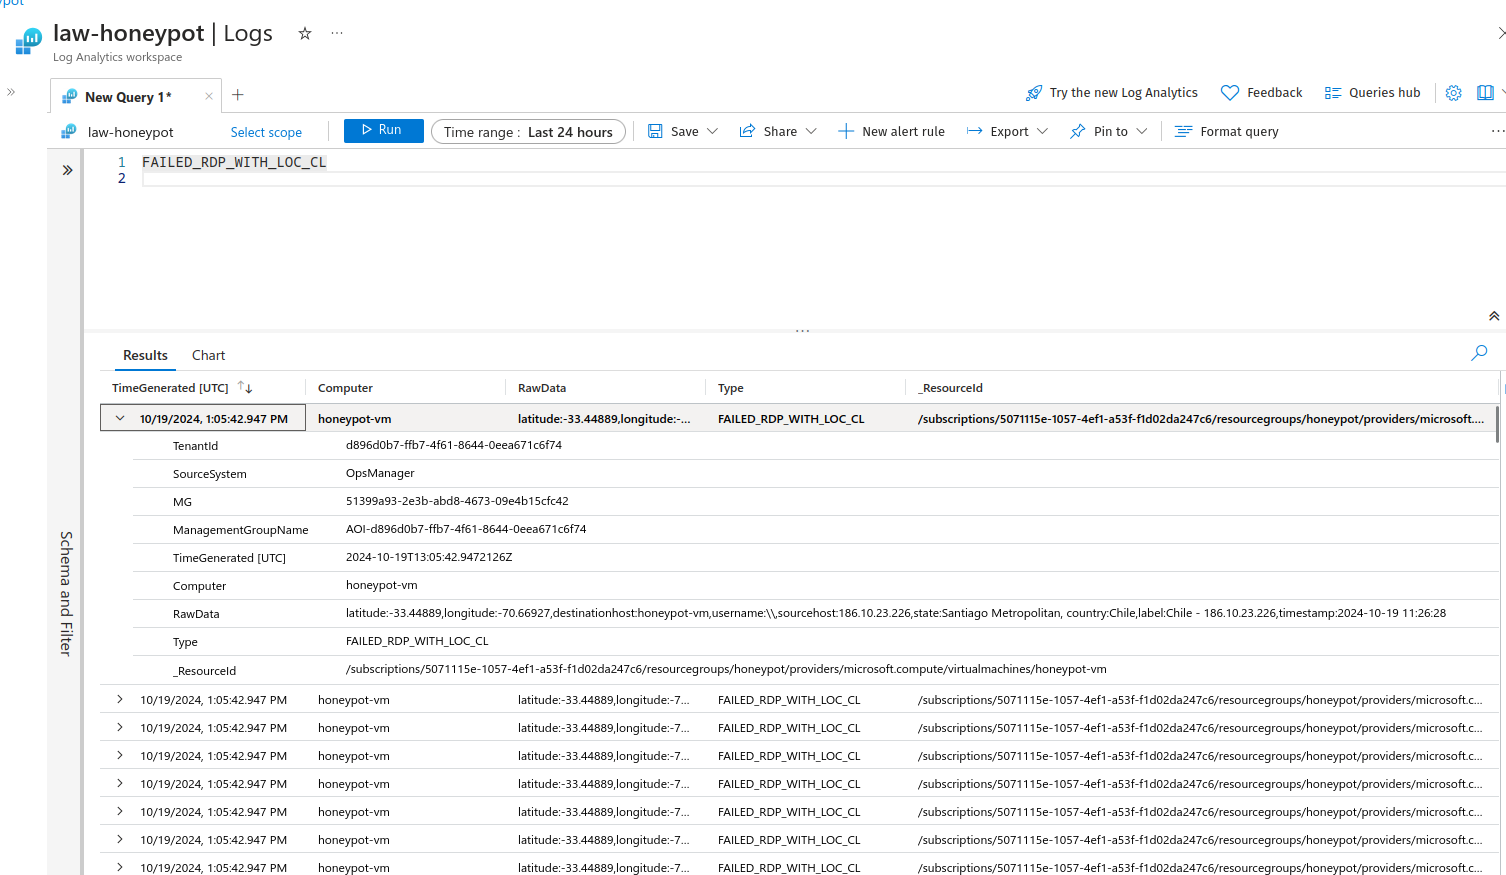
Now use this query, it extracts and summarises the raw data:
FAILED_RDP_WITH_LOC_CL
|extend username = extract(@"username:([^,]+)", 1, RawData),
         timestamp = extract(@"timestamp:([^,]+)", 1, RawData),
         latitude = extract(@"latitude:([^,]+)", 1, RawData),
         longitude = extract(@"longitude:([^,]+)", 1, RawData),
         sourcehost = extract(@"sourcehost:([^,]+)", 1, RawData),
         state = extract(@"state:([^,]+)", 1, RawData),
         label = extract(@"label:([^,]+)", 1, RawData),
         destination = extract(@"destinationhost:([^,]+)", 1, RawData),
         country = extract(@"country:([^,]+)", 1, RawData)
 |where destination != "samplehost"
 |where sourcehost != ""
 |summarize event_count=count() by timestamp, label, country, state, sourcehost, username, destination, longitude, latitude
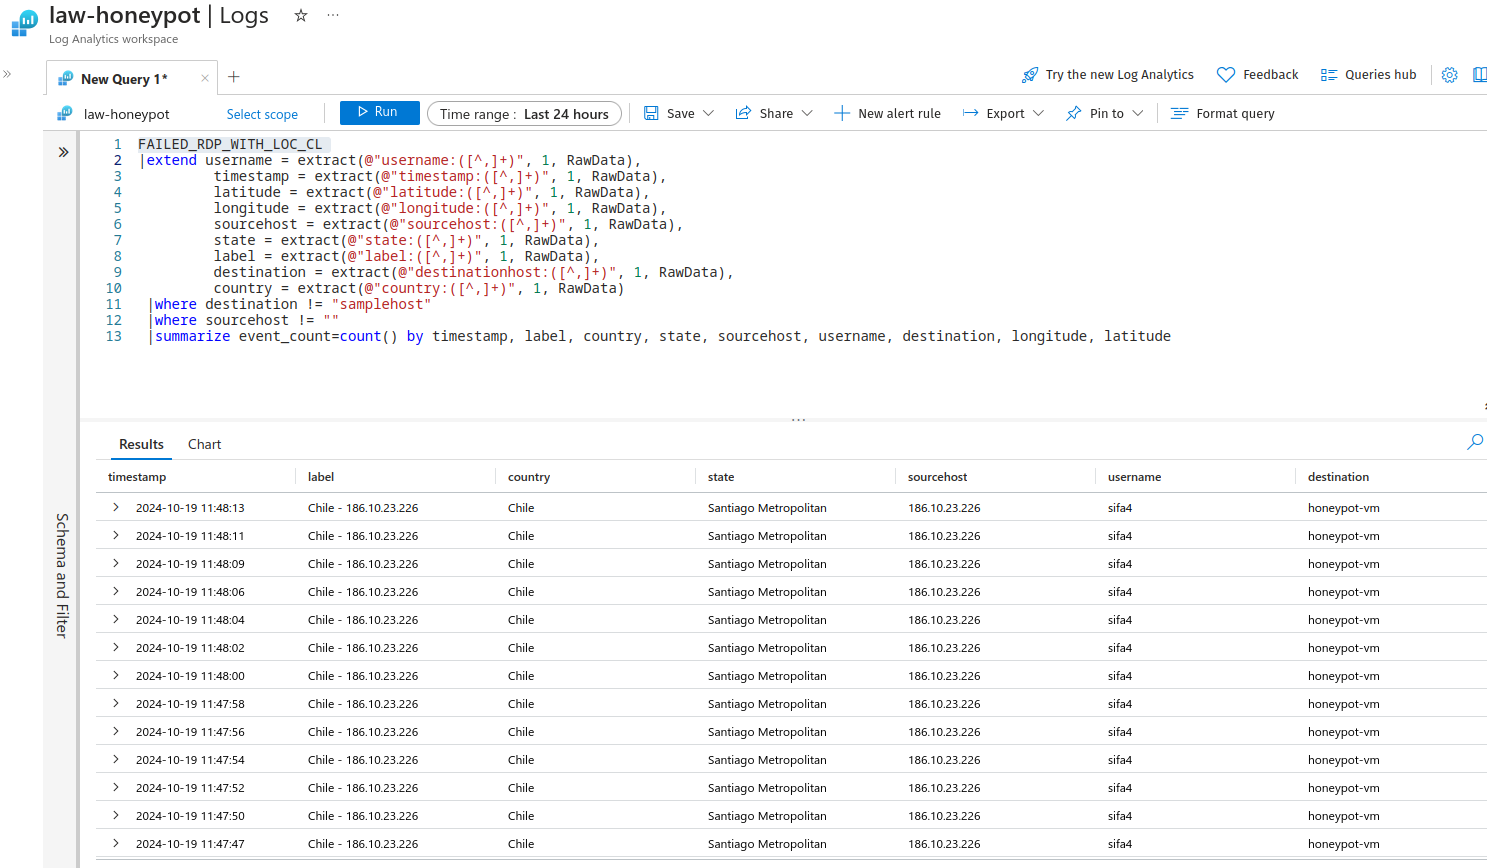
Final Steps #
Go to Sentinel and then Workbooks:
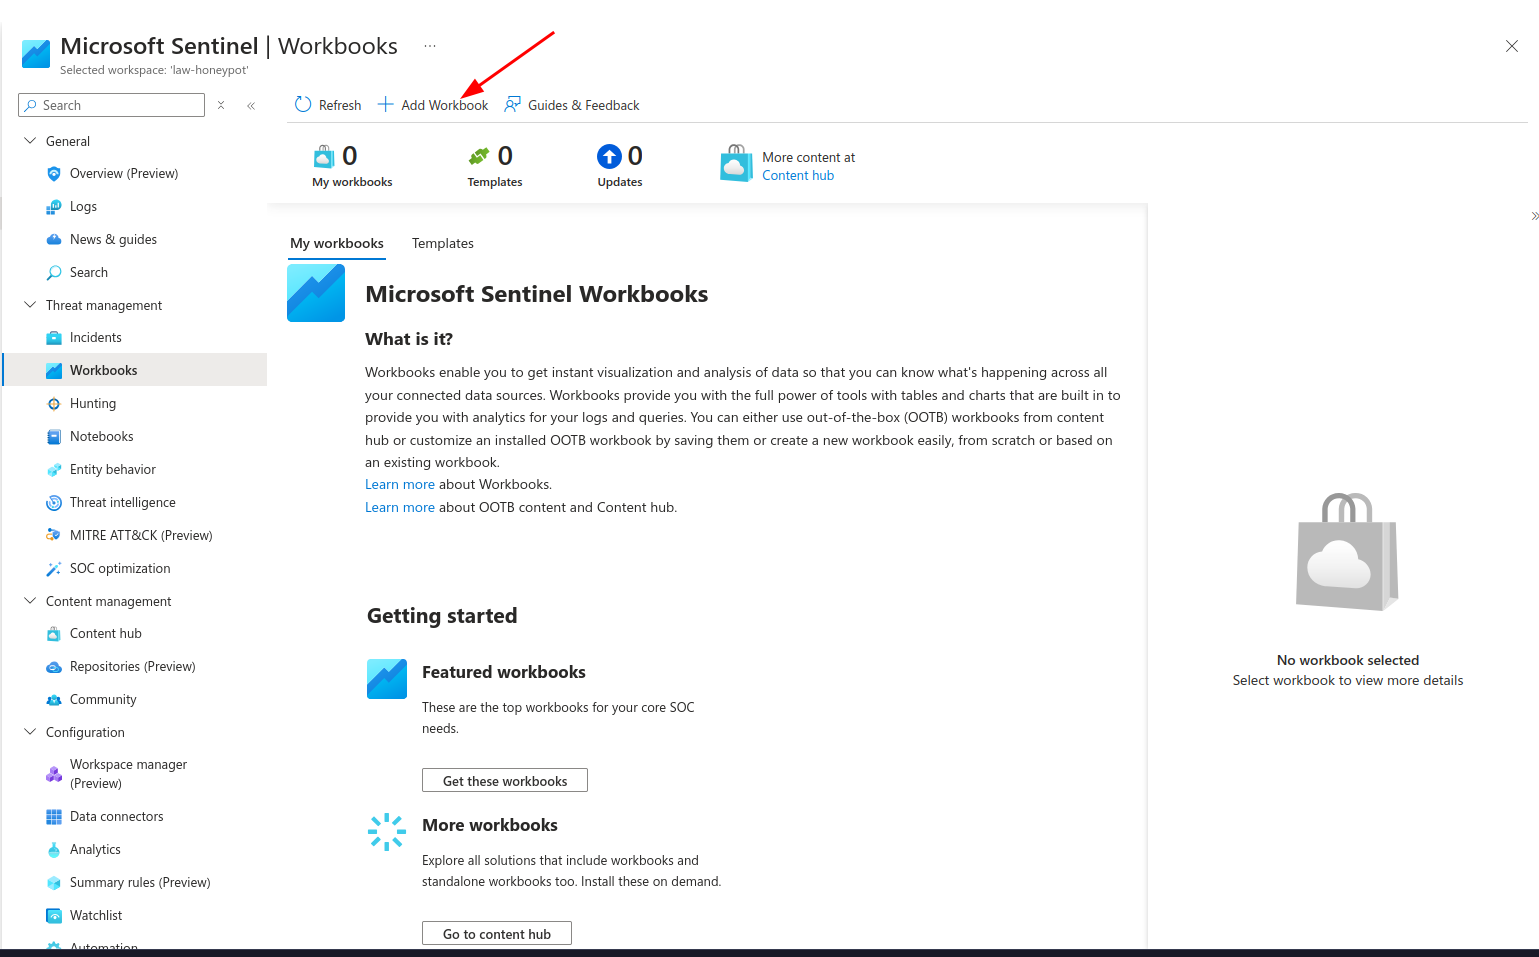
Delete the pre-existing chart and add a new query:
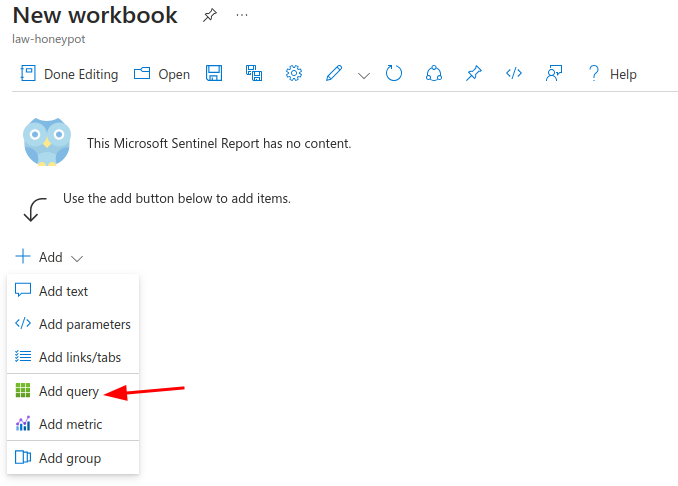
Use the same query from eariler:
FAILED_RDP_WITH_LOC_CL
|extend username = extract(@"username:([^,]+)", 1, RawData),
         timestamp = extract(@"timestamp:([^,]+)", 1, RawData),
         latitude = extract(@"latitude:([^,]+)", 1, RawData),
         longitude = extract(@"longitude:([^,]+)", 1, RawData),
         sourcehost = extract(@"sourcehost:([^,]+)", 1, RawData),
         state = extract(@"state:([^,]+)", 1, RawData),
         label = extract(@"label:([^,]+)", 1, RawData),
         destination = extract(@"destinationhost:([^,]+)", 1, RawData),
         country = extract(@"country:([^,]+)", 1, RawData)
 |where destination != "samplehost"
 |where sourcehost != ""
 |summarize event_count=count() by timestamp, label, country, state, sourcehost, username, destination, longitude, latitude
Now we can change visualisation to map and see the results:
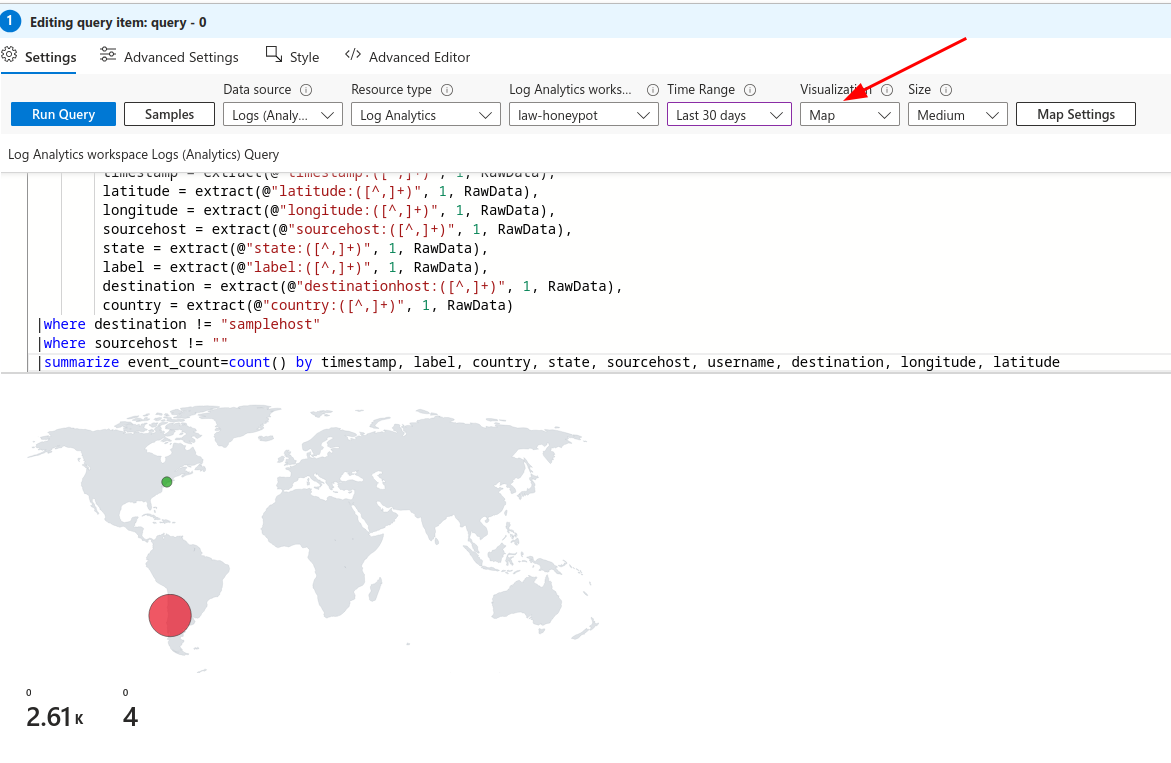
And also set the Metric Label to country after clicking on Map Settings:
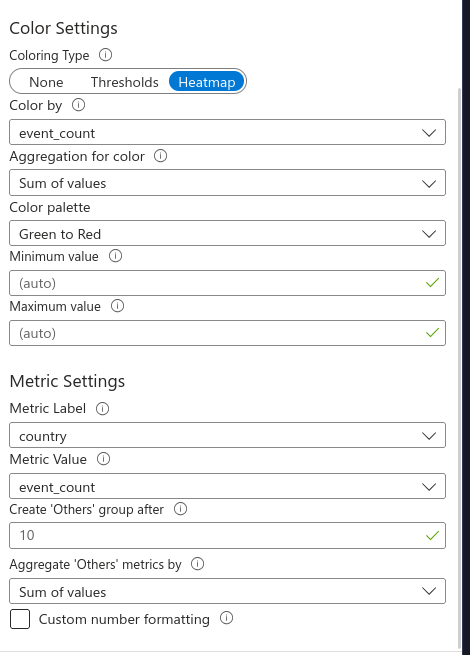
Now you can save this workbook and check on it after a few days to collect data from it:
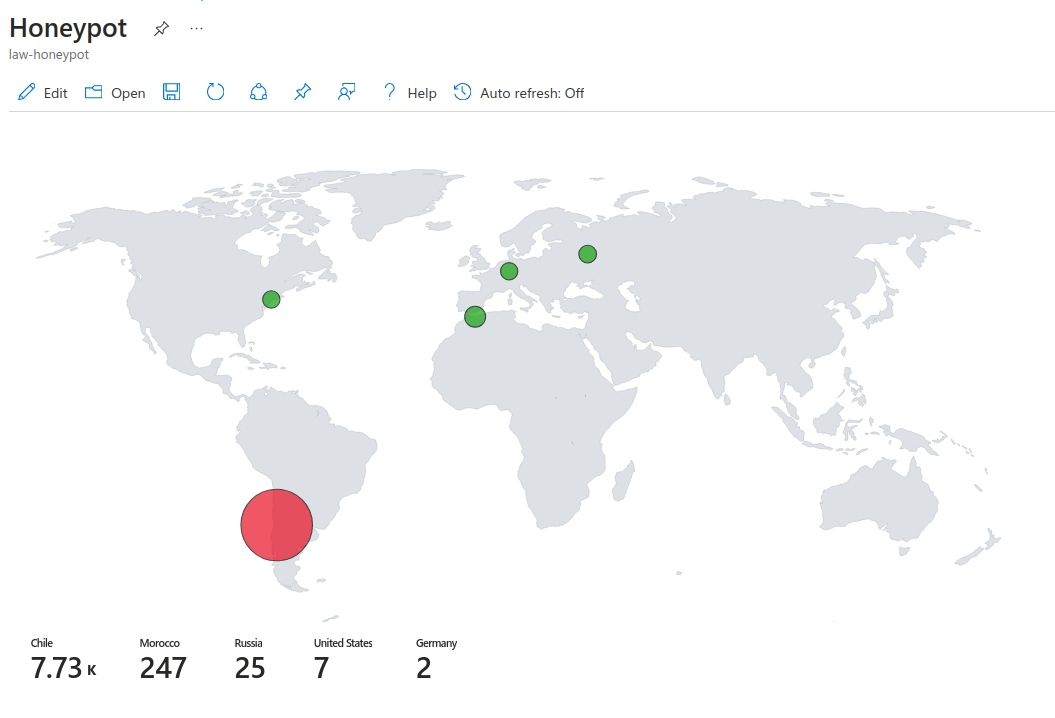
Note that the free API key from ipgeolocation will only work on 1000 IP addresses a day, you can purchase a subscription for more.
Conclusion #
The Azure SIEM and Honeypot project successfully demonstrated the practical application of cloud-based security monitoring and threat detection. By deploying a honeypot within an Azure environment, we were able to attract and monitor potential malicious activity, simulating real-world attack scenarios. Integrating the honeypot with Azure Sentinel allowed for real-time data analysis and the creation of customized detection rules, such as those tracking failed RDP attempts, to identify suspicious behavior and potential threats. This project can be further expanded upon using the new Azure Monitor for VMs as well. Thank you for reading the blog and see you on the next one!
